Take Home Exercise 1
In this Take Home Exercise, we aim to analyse the demographic structure of Singapore at planning area level by building an age-sex pyramid trellis chart.
The dataset used is downloaded from the following link:
https://www.singstat.gov.sg/find-data/search-by-theme/population/geographic-distribution/latest-data
1. Step-by-Step Description
| step | action | image |
|---|---|---|
| 1 | Open Tableau Desktop, and load the downloaded file into Tableau using Text file. Once the raw dataset is loaded, drag the Singapore Residents by Planning Area / Subzone, Age Group, Sex and Type of Dwelling, June 2022 csv file into Tableau Desktop. |
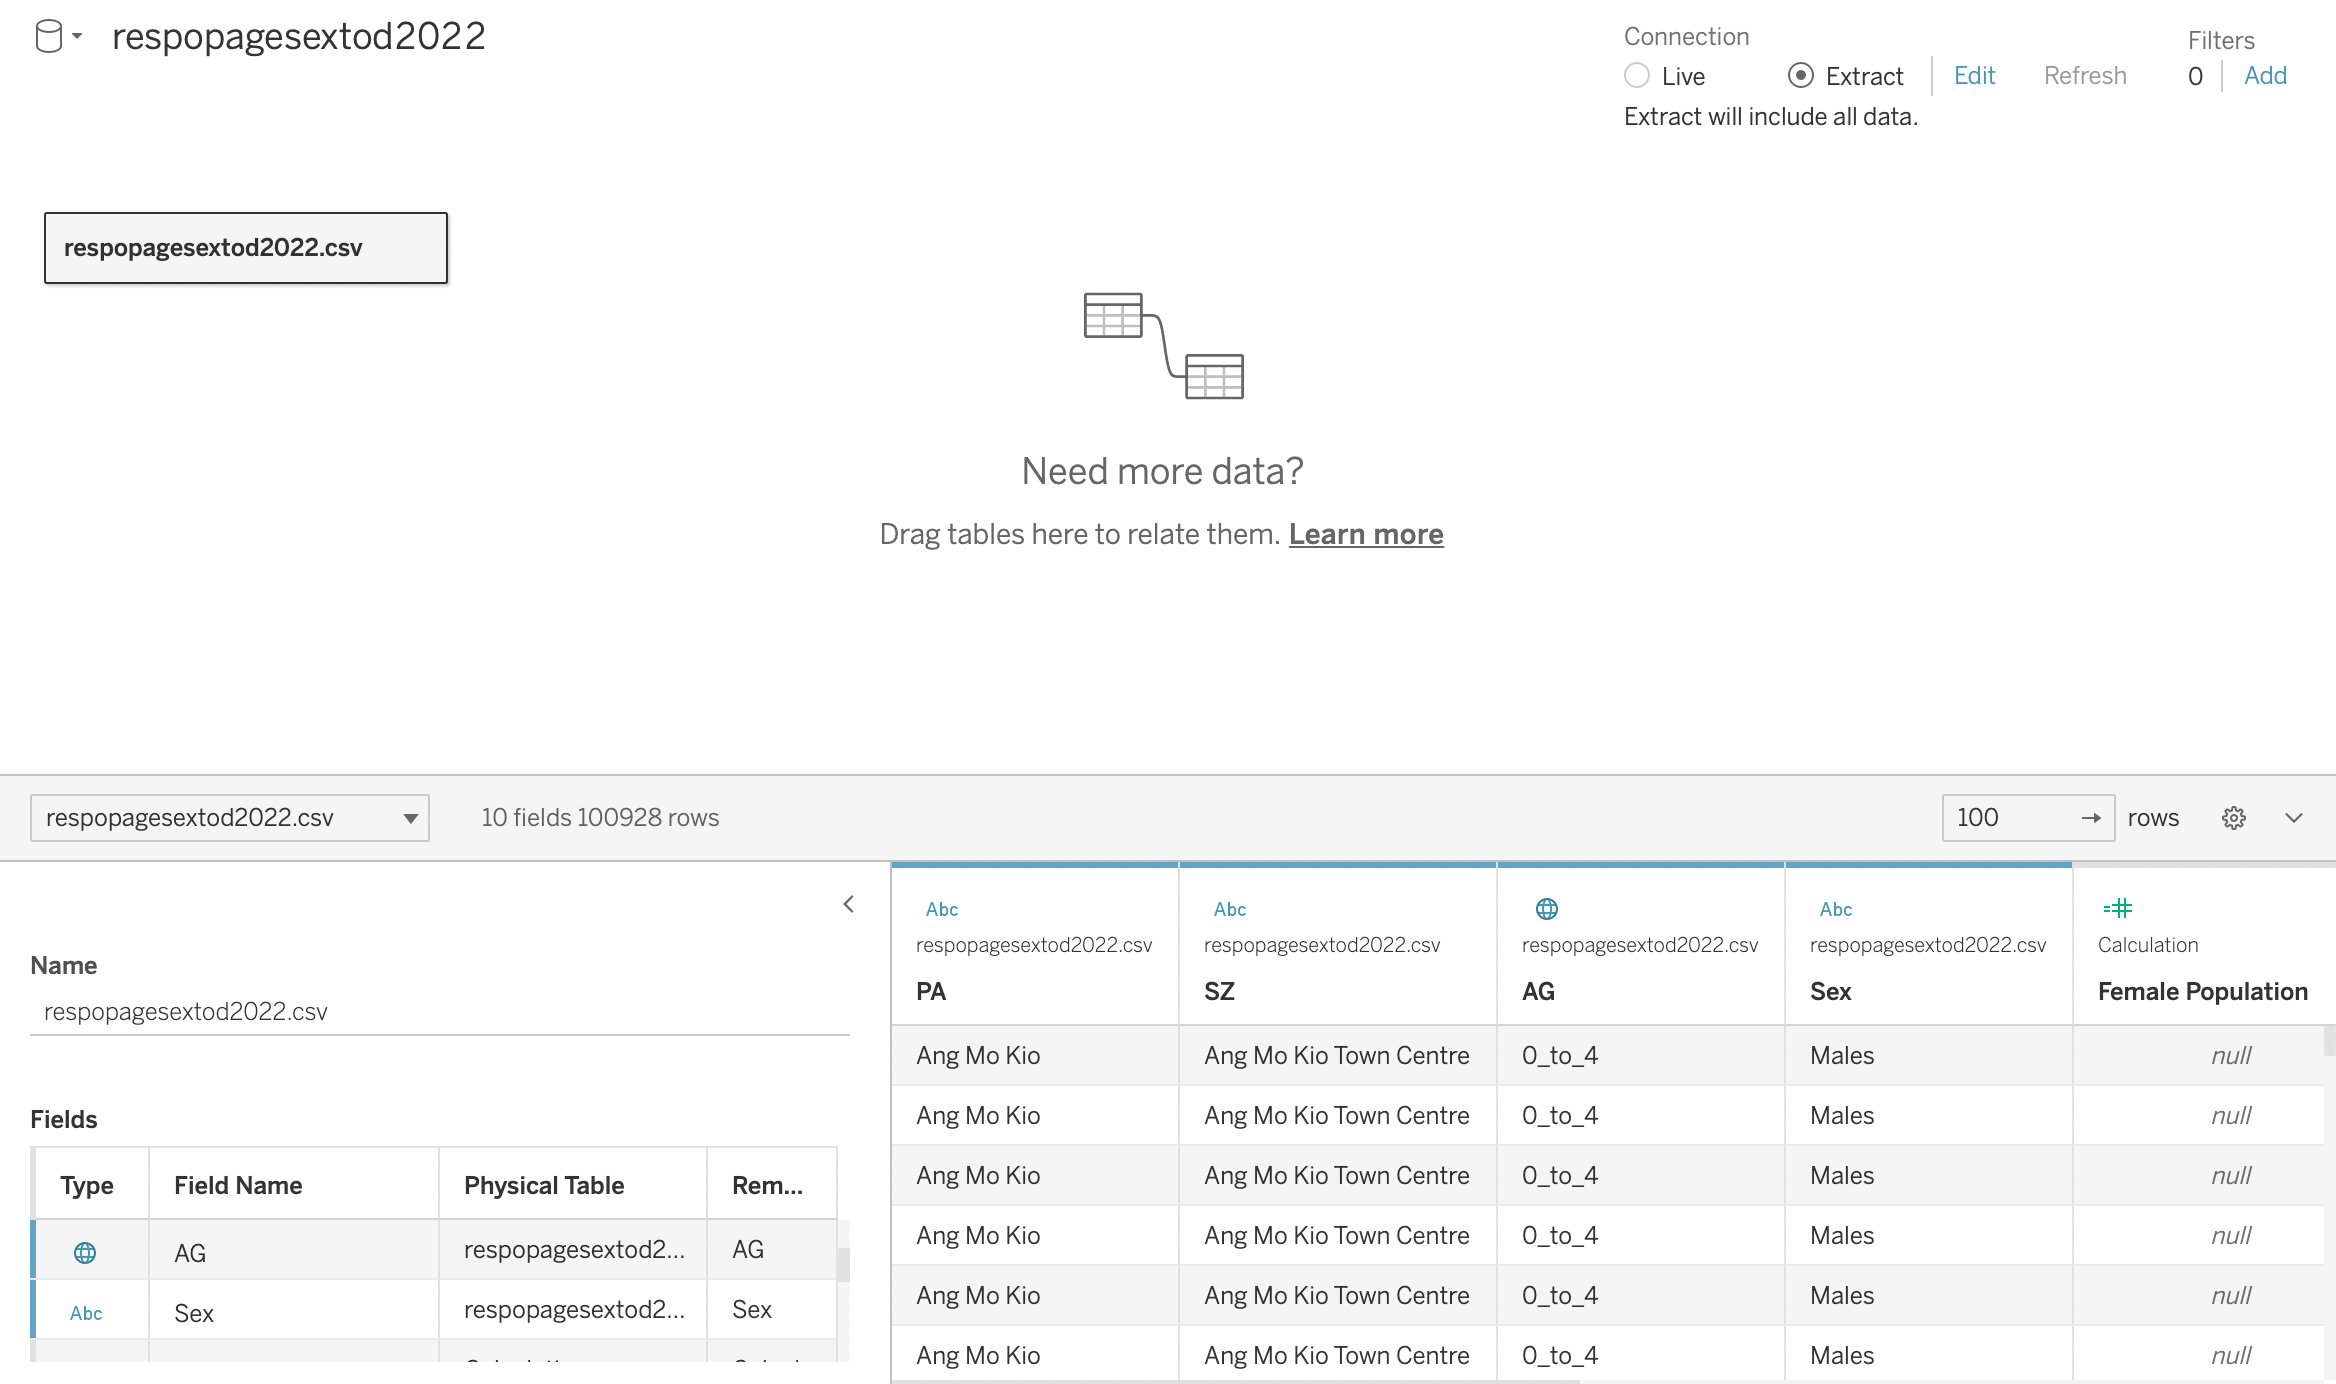 |
| 2 | Tabulate Female population. We created a calculated field for female population. Write a formula based on Population containing “female” word under “Sex” category to extract female population. |
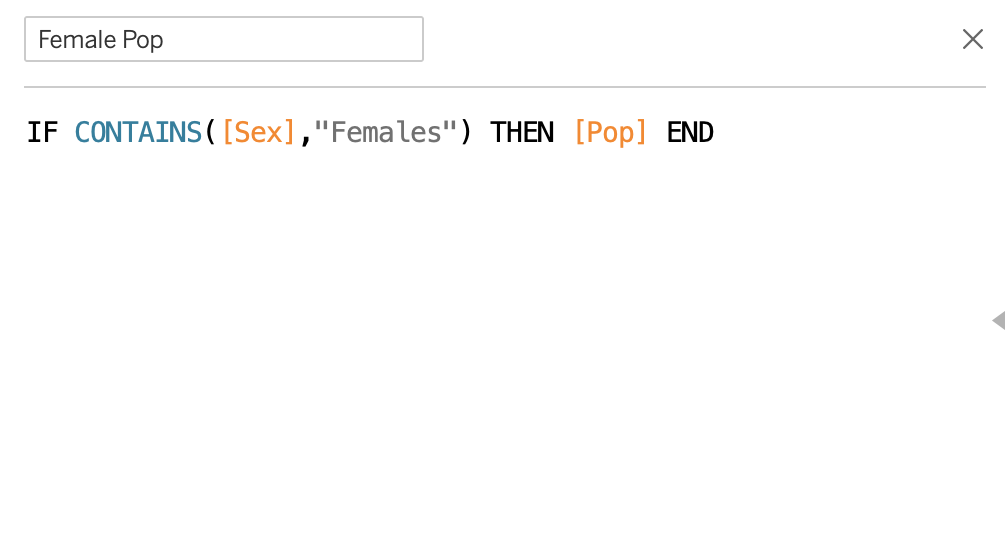 |
| 3 | Tabulate Male population. We created a calculated field for male population. Write a formula based on Population containing “male” word under “Sex” category to extract male population. |
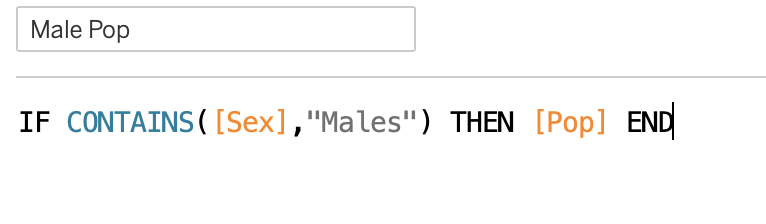 |
| 4 | Create the Matrix for trellis display (3 * 3 for 9 Planning Areas). We created a calculated field for Row calculation, and convert it to discrete. | 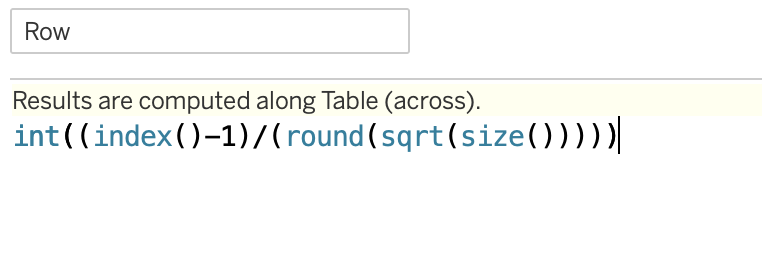 |
| 5 | We created a calculated field for Column calculation, and convert it to discrete. | 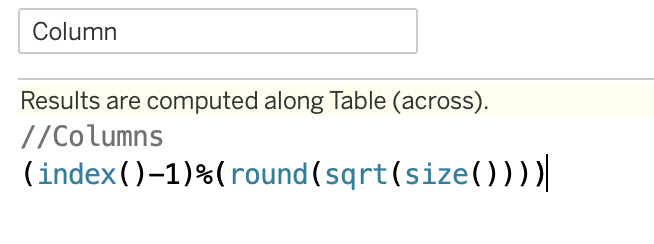 |
| 6 | Create Age Group from AG. Combine each two adjacent age group for easier display. | 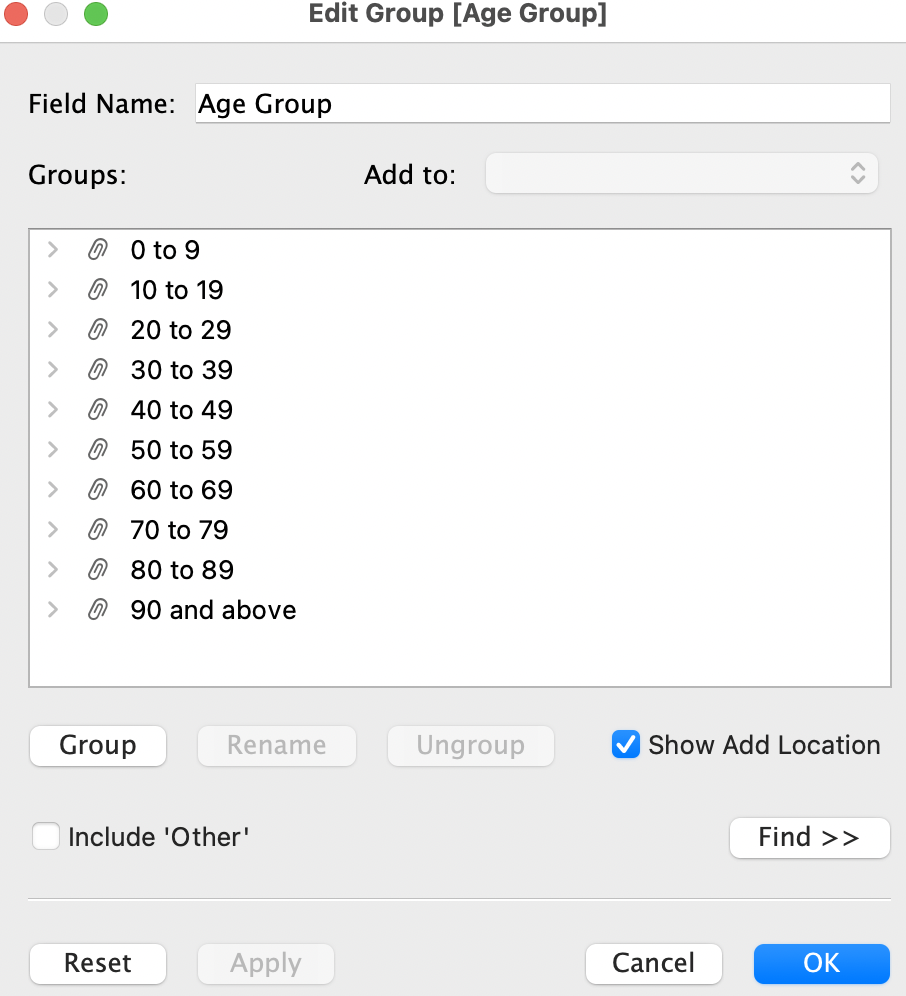 |
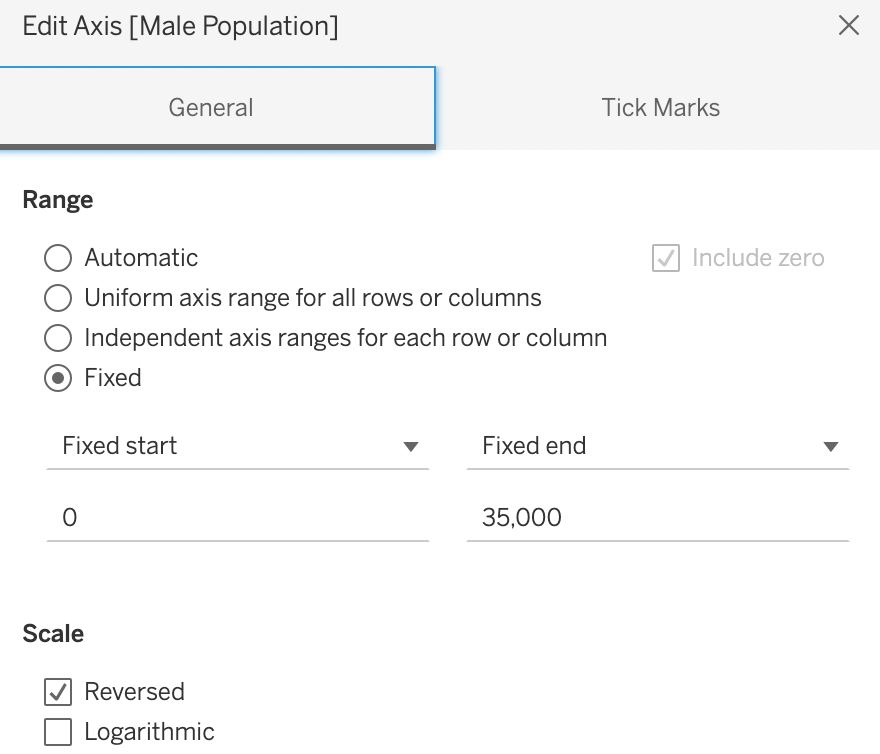
| 7 | Drag Female Pop and Male Pop to Columns field. Edit Axis of Female Pop to be reverse. | 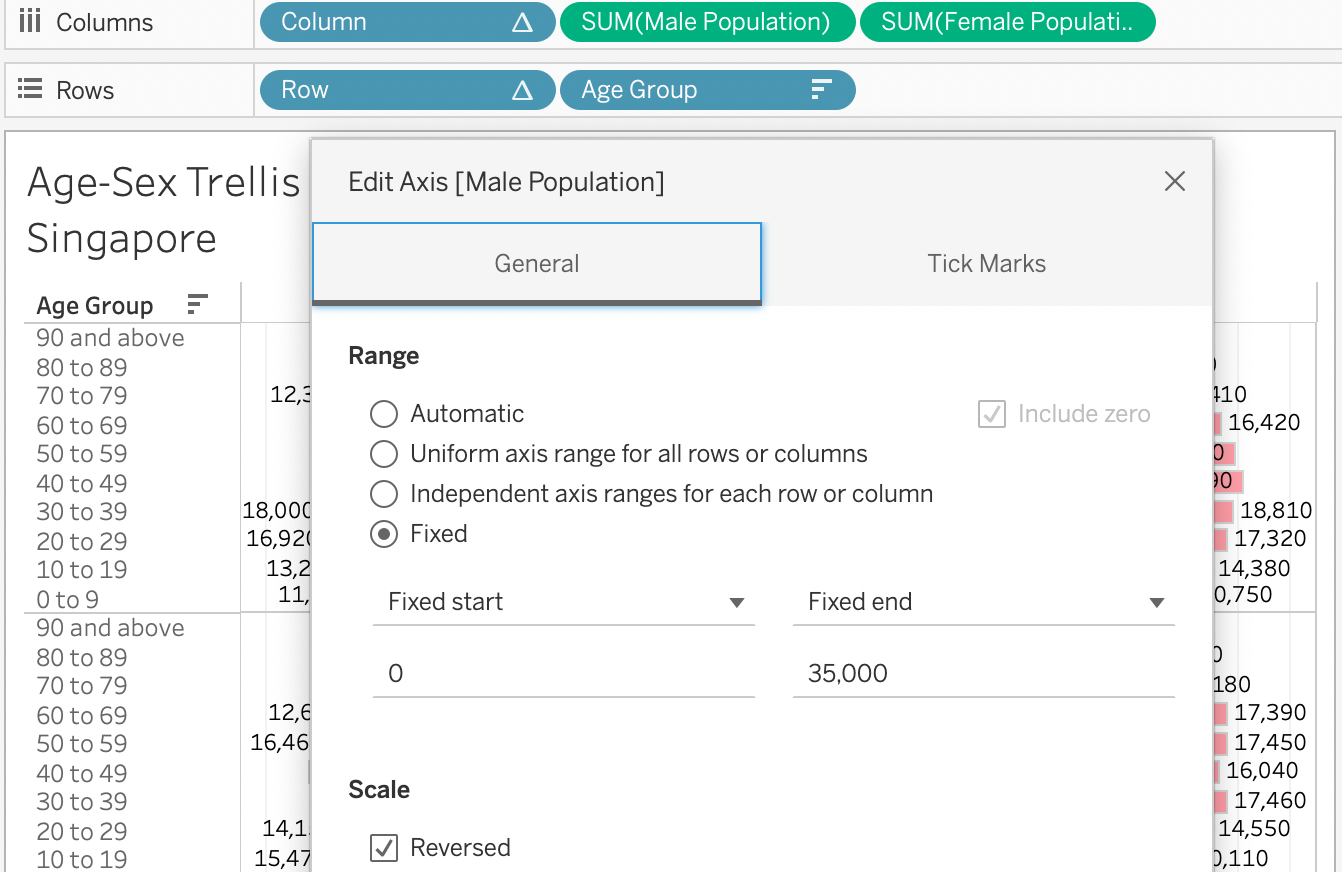 |
| 8 | Drag AG(group) to Rows. Sort AG(group) in descending order. | 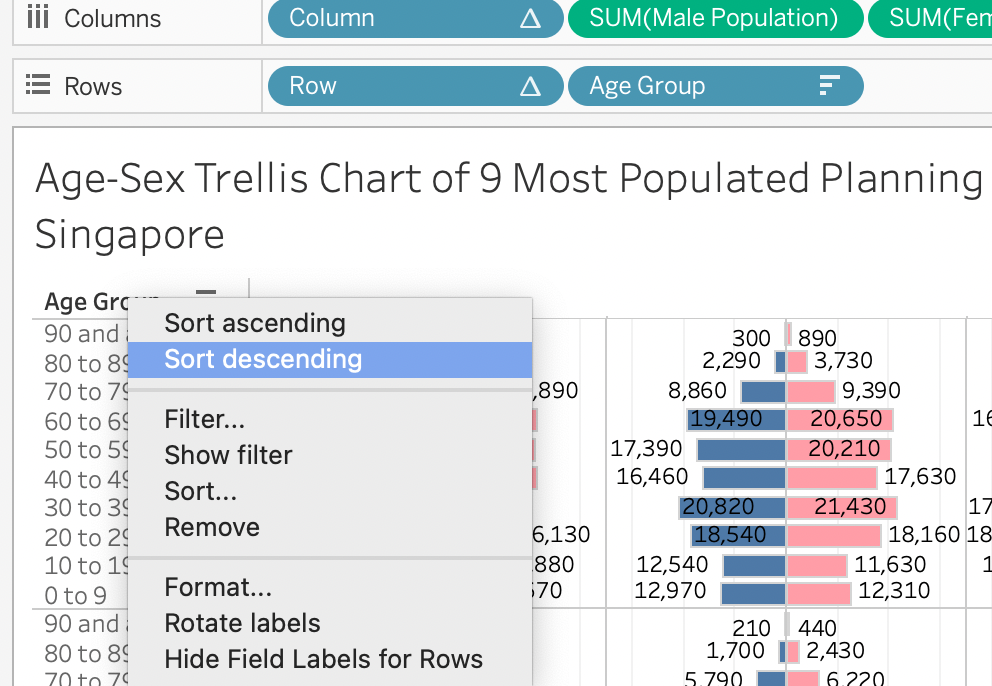 |
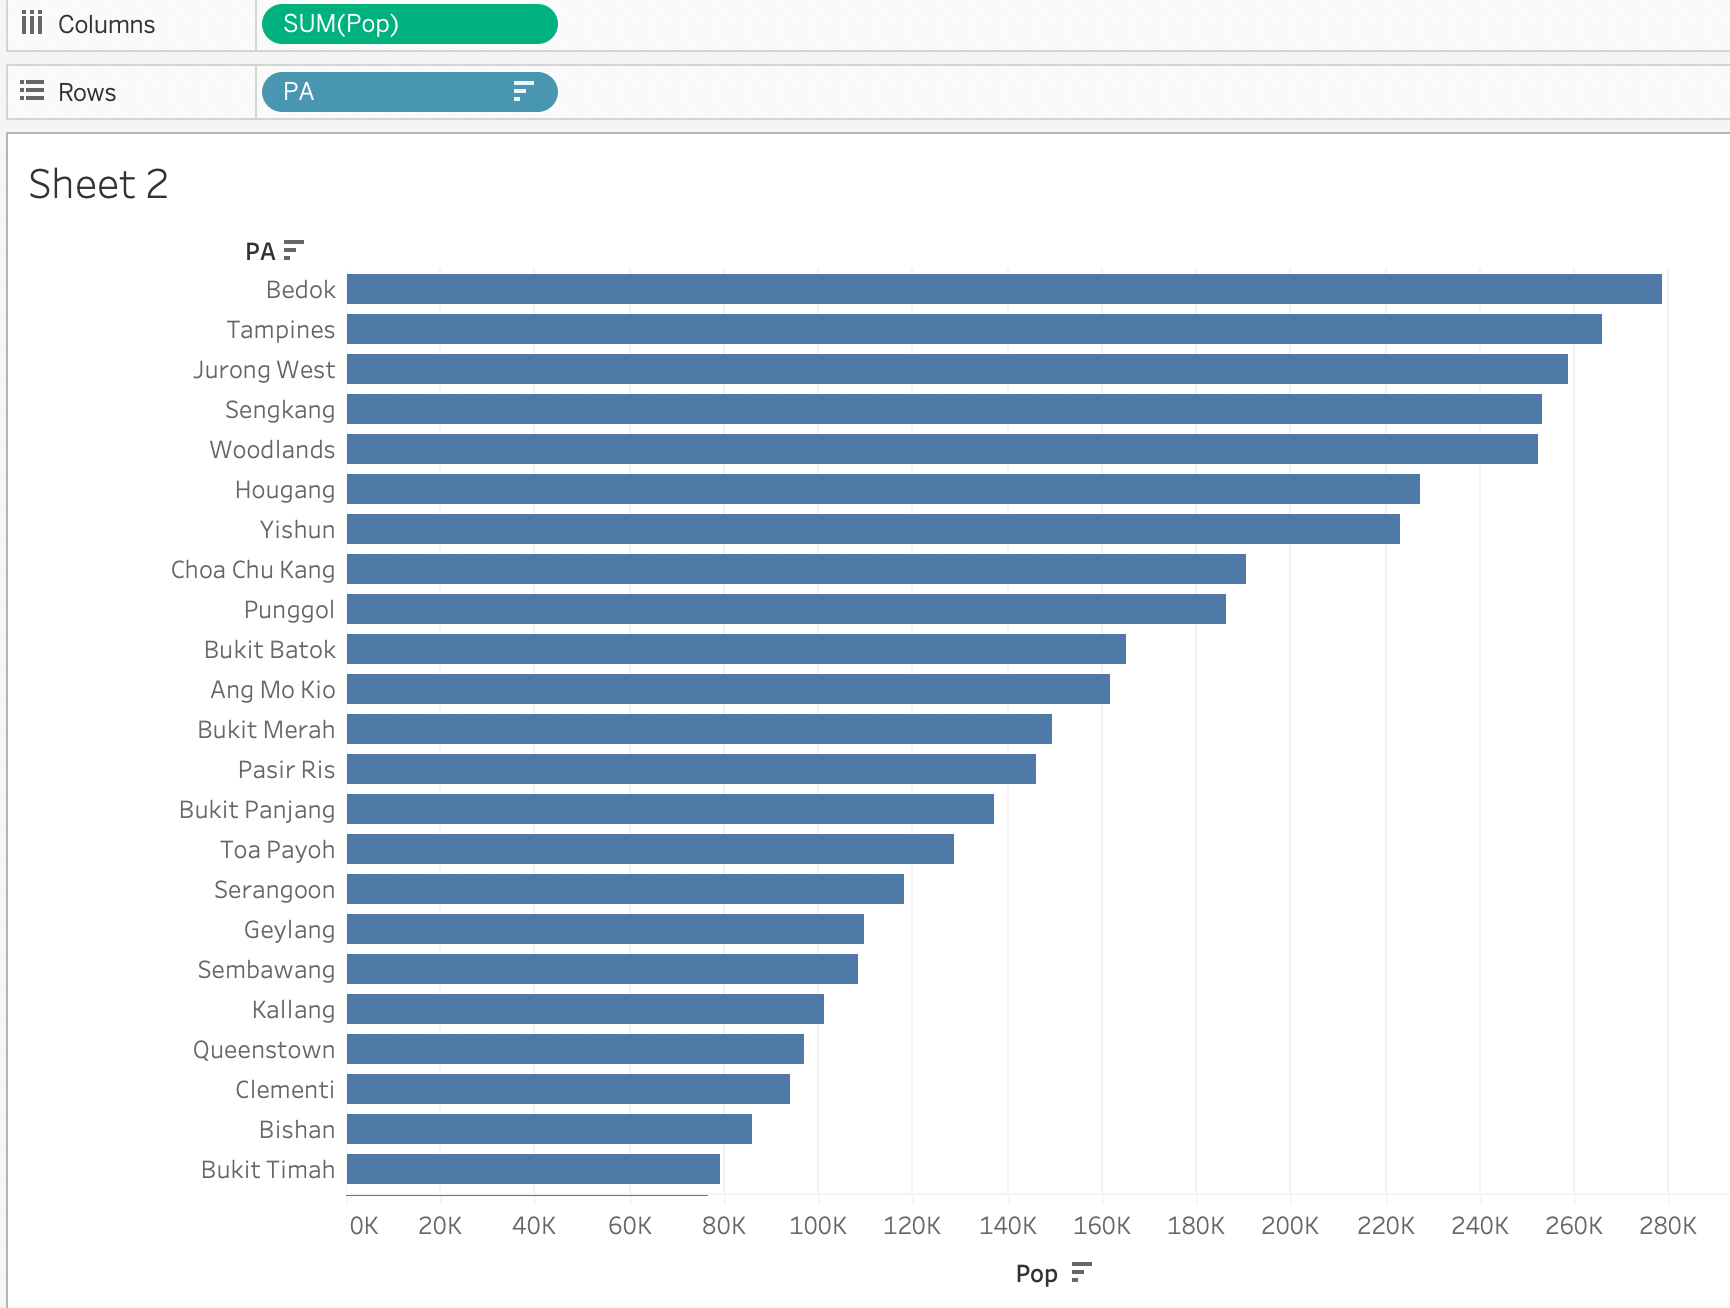
| 9 | Drag PA into Filters and select 9 most populated planning areas. We select the 9 most populated planning areas by opening another worksheet. Drag Pop into Columns and PA into Rows. Sort Pop in descending orders. From this chart, it’s clearly seen that the top 9 most populated planning areas are: Bedok, Tampines, Jurong West, Sengkang, Woodlands, Hougang, Yishun, Choa Chu Kang, and Puggol. Delete this worksheet after obtaining the planning area information. We filter the selected 9 PA in the original worksheet. |
 |
| 10 | Drag PA into Details under Marks Tab | 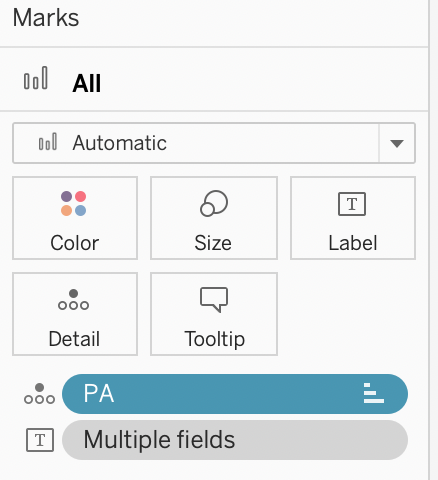 |
| 11 | Drag Column to Columns. Row to Rows. Edit the Table Calculation for both Row and Column. Change to “Compute using Specific Dimensions” and select PA. Choose “At the level” to be PA. Do the same for Column. |
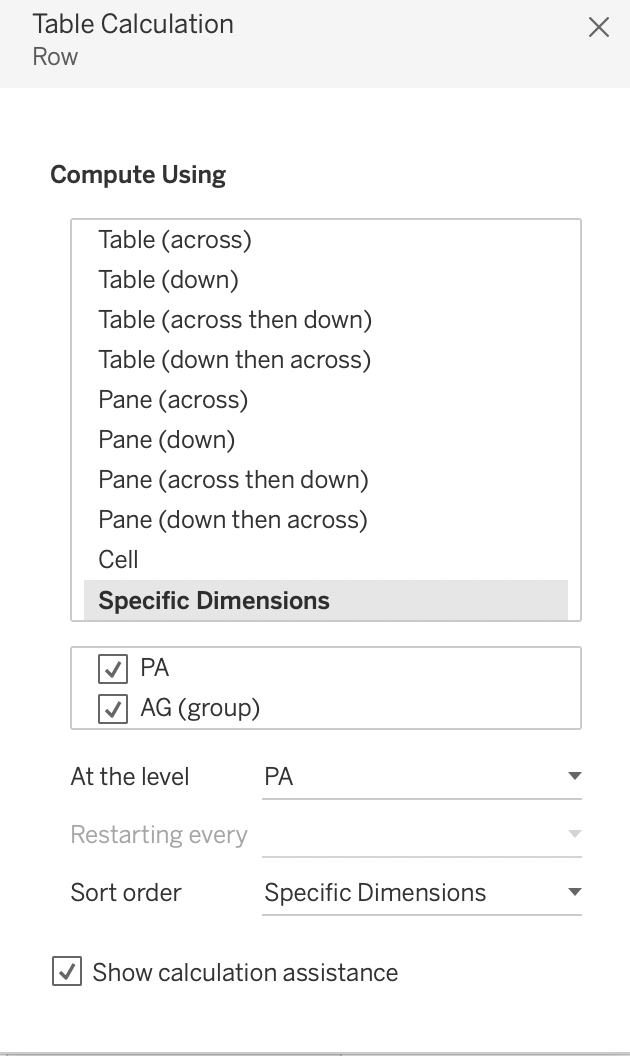 |
| 12 | Hide the Row and Column axis by unchecking the Show Header. | 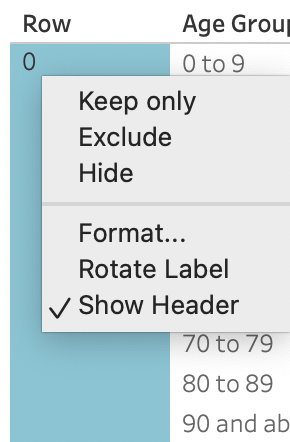 |
| 13 | Under Marks Female Pop, change the color of female population tab to be pink. That of male population to be blue. | 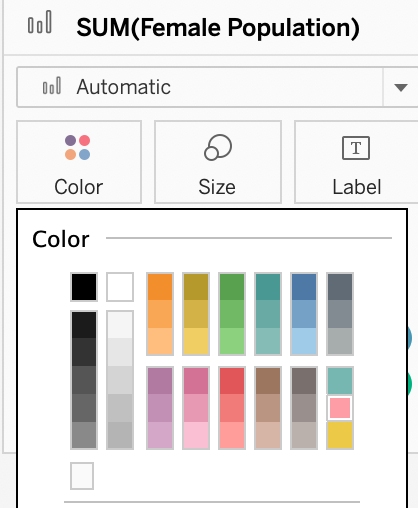 |
| 14 | Drag Female Pop into Label of SUM(Female Pop) and Male Pop into Label of SUM(Male Pop). | |
| 15 | Edit Axis of x axis (Female Pop and Male Pop). Choose Fixed range to be 0 to 35K. This is to make sure all population share x axis of the same range. |
 |
| 16 | Create a new Dashboard. Drag the worksheet into the dashboard area. | 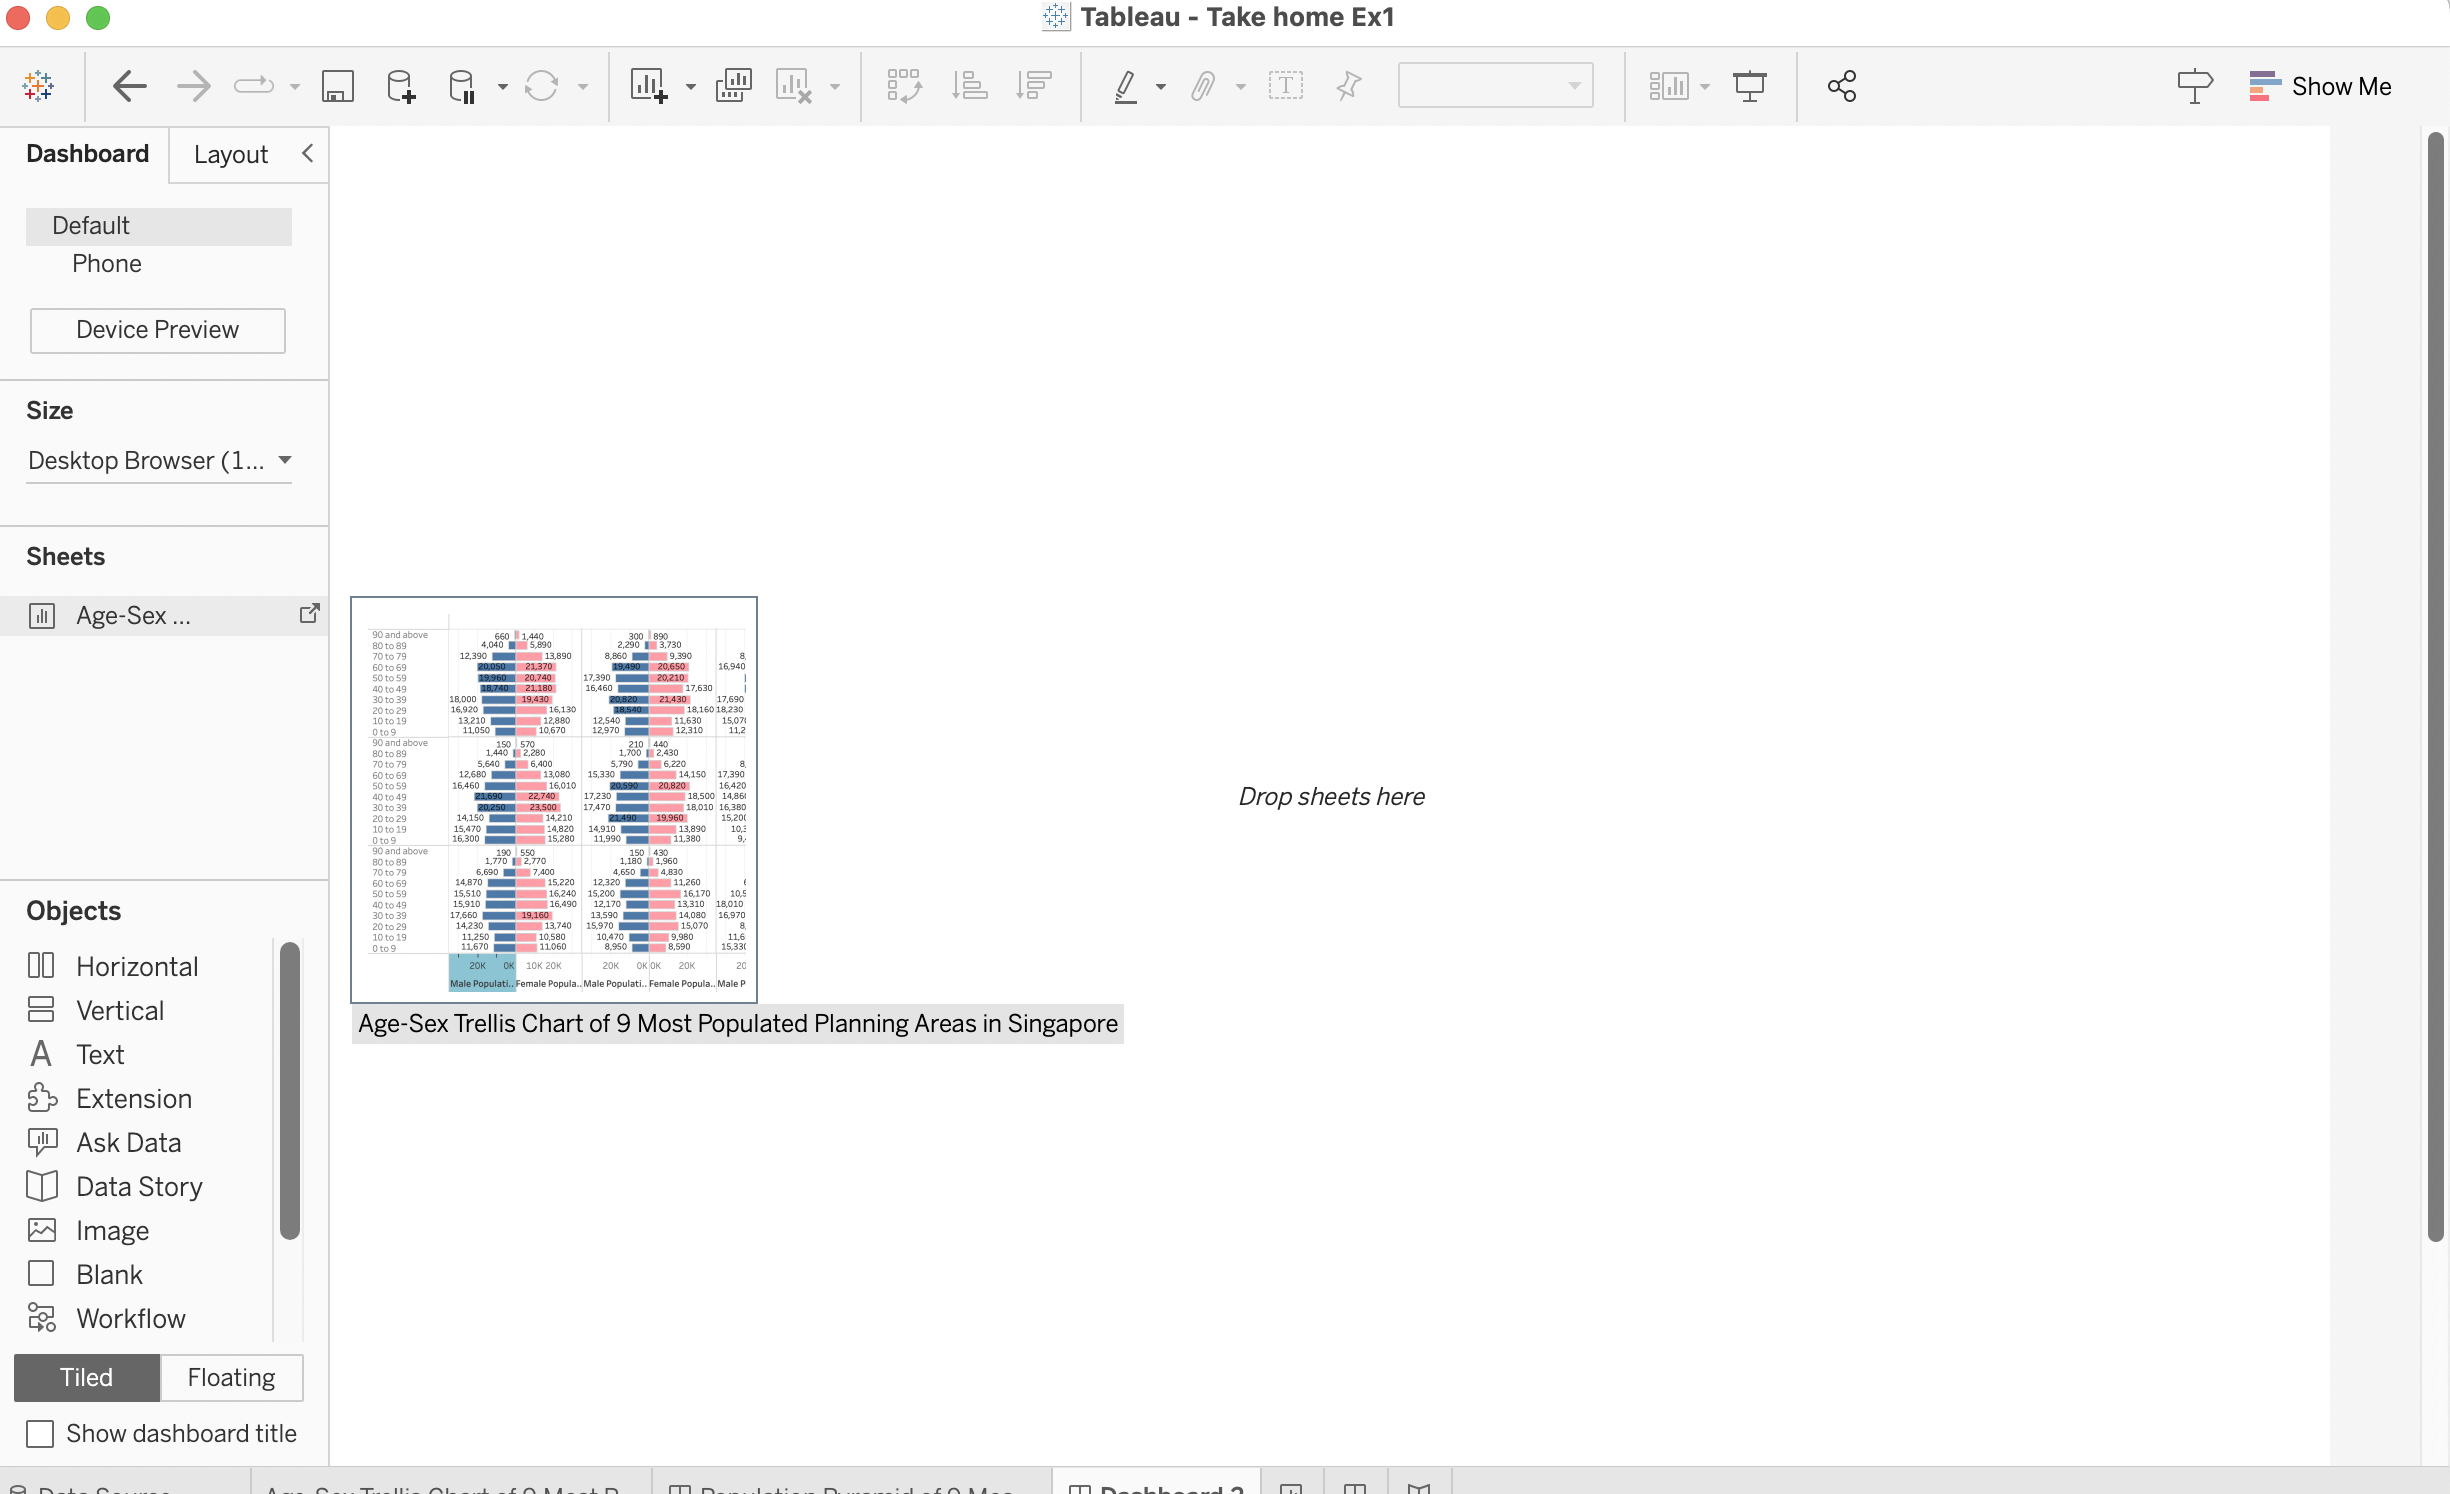 |
| 17 | Add text box to show the different planning areas. Choose black color to improve on visual contrast and locate them to be on top right hand corner of each sub plot. | 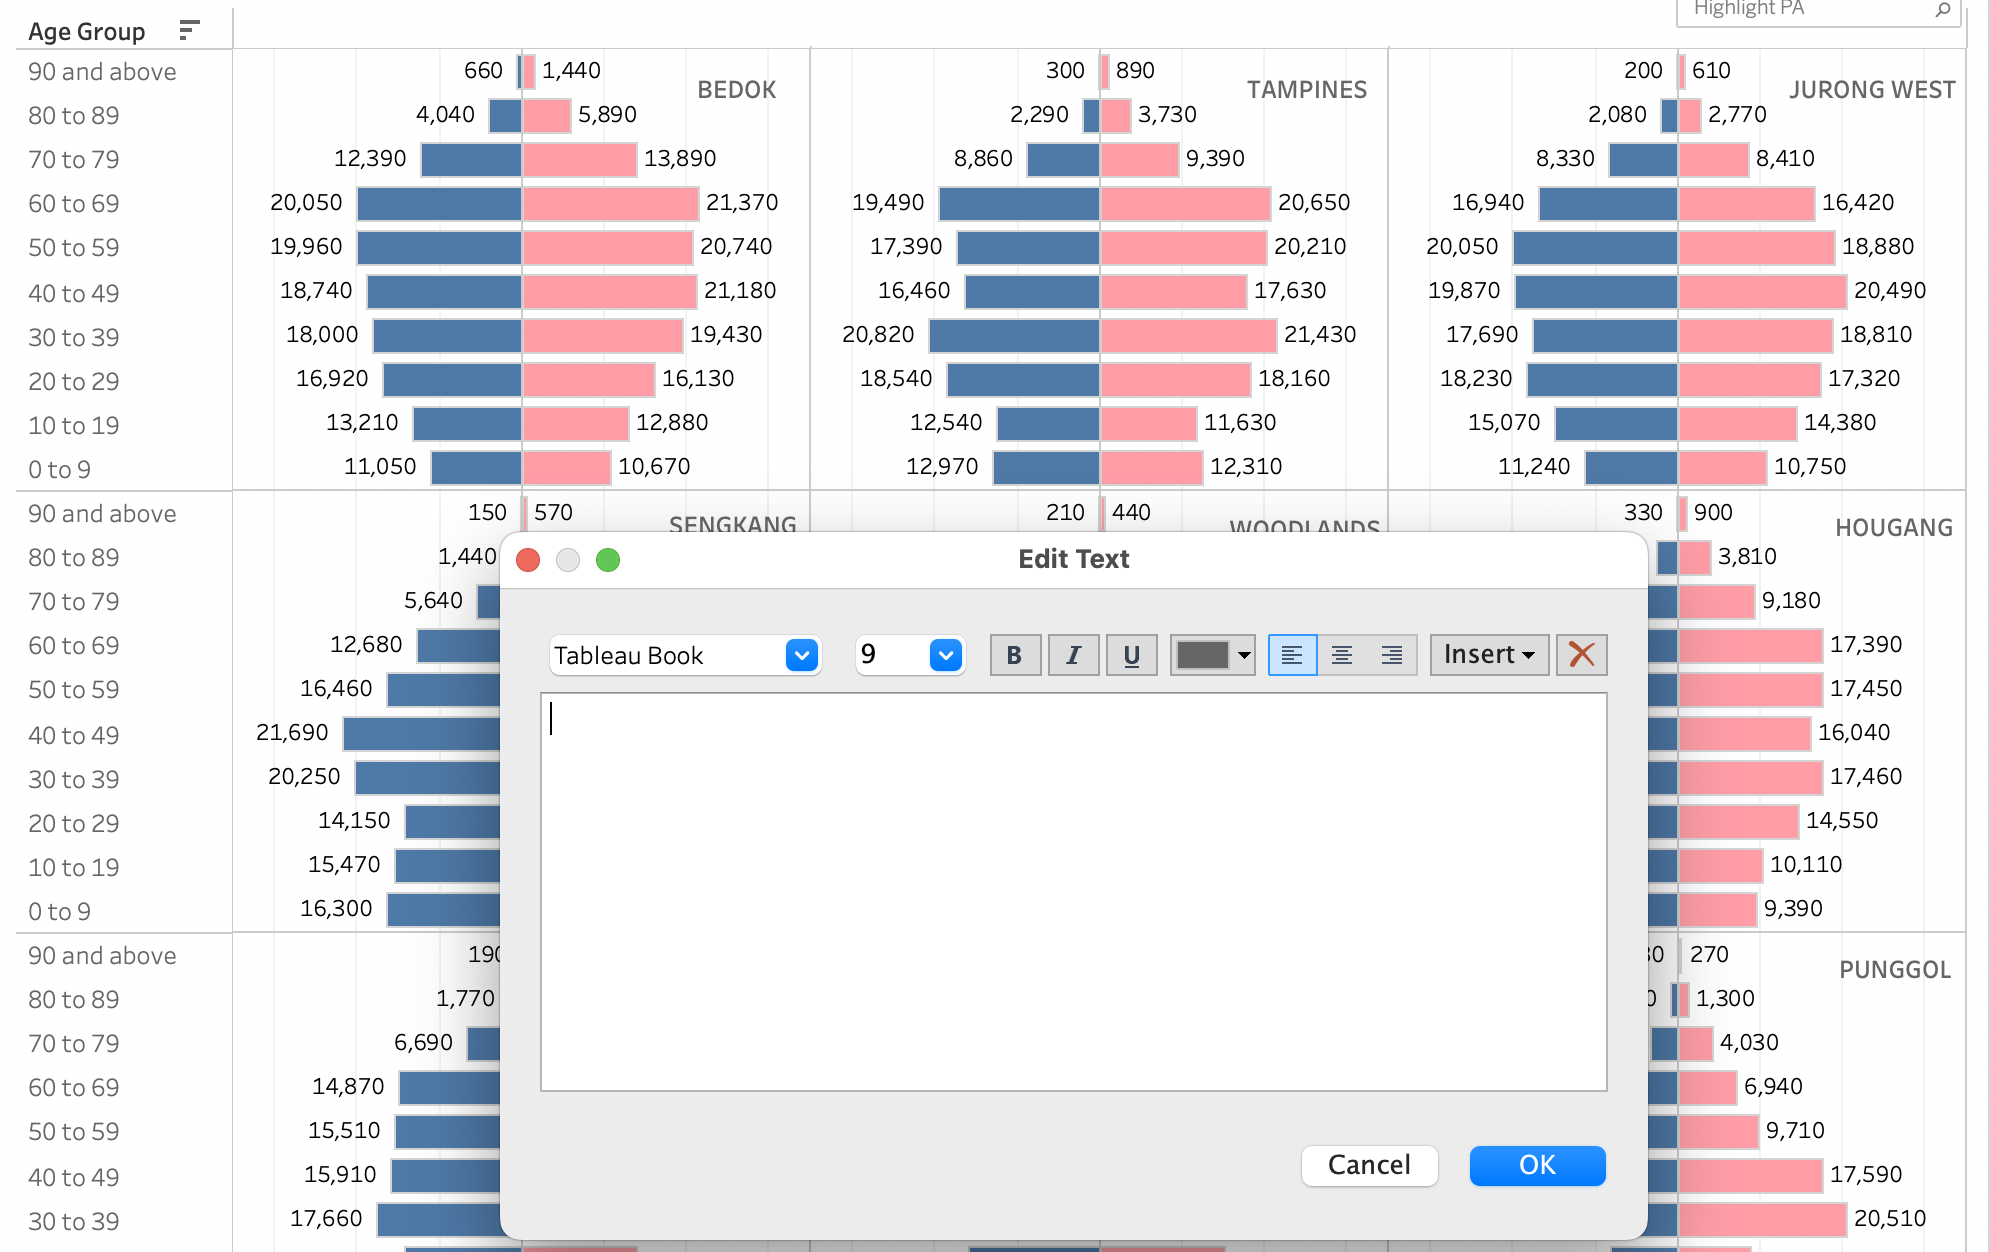 |
2. Major Observations
We have selected the most populated 9 planning areas in Singapore based on SingStat data dated in June 2022, namely: Bedok, Tampines, Jurong West, Sengkang, Woodlands, Hougang, Yishun, Choa Chu Kang, and Puggol, for visual analysis. These 9 planning areas are chosen as we can observe the population pyramid shape more clearly.
.png)
Similarities observed among all planning areas:
The population pyramid in these 9 planning areas of Singapore exhibit a “constrictive” population pyramid shape, with a relatively narrow base and a wide middle portion. There are lower number of young people (age group 0 to 19) compared to middle-aged people (age group 30 to 49), implying a low fertility rate in general.
There is a broad shape at top, showing a high life expectancy in Singapore, with a high proportion of elderly population(age group 70 and above). There is a higher number of female elderly population compared to male elderly population across all planning groups, indicating that usually female has a longer life expectancy than male.
Male and female population are similar across all planning areas, indicating a good gender equality in Singapore.
These most populated planning areas all fall under Outside Central Region and are residential areas. The low residential accommodation price, and abundance of residential properties may lead to high population in these areas.
Differences observed among planning areas:
There is a narrowing base observed in Bedok, Jurong West, Woodlands, Hougang and Choa Chu Kang. This indicates a falling birth rate in these planning areas. Whereas in the other 4 planning areas, there are more population under 0-9 age group, indicating that the birth rate has improved. The most significant increase in fertility is observed in Punggol. It could lead to more nursery and schools demands in Punggol area.
There are differences in bulges observed in different planning areas. For example, there are significant bulges observed in Punggol and Sengkang area for population under age group 30 to 49. This could be due to residents relocation to Punggol and Sengkang for work purpose. While Bulges for Bedok are observed in 50 to 69 age group population. This may suggest that Bedok is good for retirement.
There are differences in indents observed in different planning areas. For example, there are significant indents observed in Woodlands for 30 to 49 age group population. While indents for Punggol happens significantly for 20 to 29 age group population. This could be due to residence relocation due to education, work or other reasons.
Top 3 planning areas with the most number of elderly (age group 70 and above) are Bedok, Tampines and Hougang. While in terms of total population, the top 3 planning areas are Bedok, Tampines and Jurong West. Hougang ranks number 6 in total population. This suggests that Hougang has a relatively higher proportion of elderly population. Elderly facilities would be in needed in Hougang area.
The above concludes the take home exercise 1. Thank you for reading!