pacman::p_load(seriation, dendextend, heatmaply, tidyverse, GGally, parallelPlot)Hands-on_Ex05_2
Heatmap
Install and Launch R Packages using pacman
wh <- read_csv("data/WHData-2018.csv")Rows: 156 Columns: 12
── Column specification ────────────────────────────────────────────────────────
Delimiter: ","
chr (2): Country, Region
dbl (10): Happiness score, Whisker-high, Whisker-low, Dystopia, GDP per capi...
ℹ Use `spec()` to retrieve the full column specification for this data.
ℹ Specify the column types or set `show_col_types = FALSE` to quiet this message.Change row number by country name
row.names(wh) <- wh$CountryWarning: Setting row names on a tibble is deprecated.Transform data frame into matrix
wh1 <- dplyr::select(wh, c(3, 7:12))
wh_matrix <- data.matrix(wh)
Heatmap() of R Stats
wh_heatmap <- heatmap(wh_matrix,
                      Rowv=NA, Colv=NA)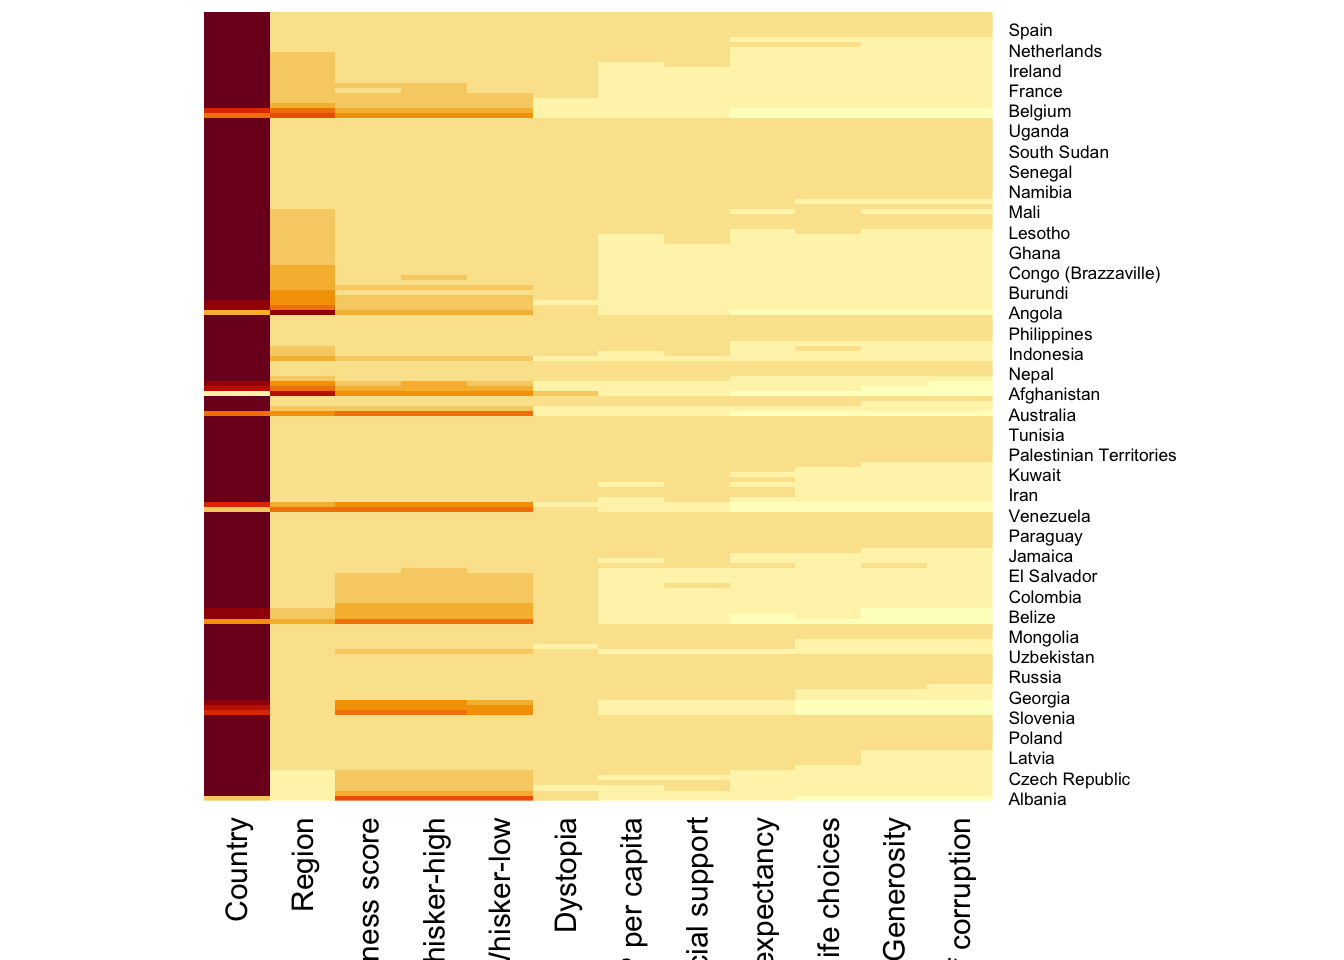
Plot a cluster heatmap
wh_heatmap <- heatmap(wh_matrix)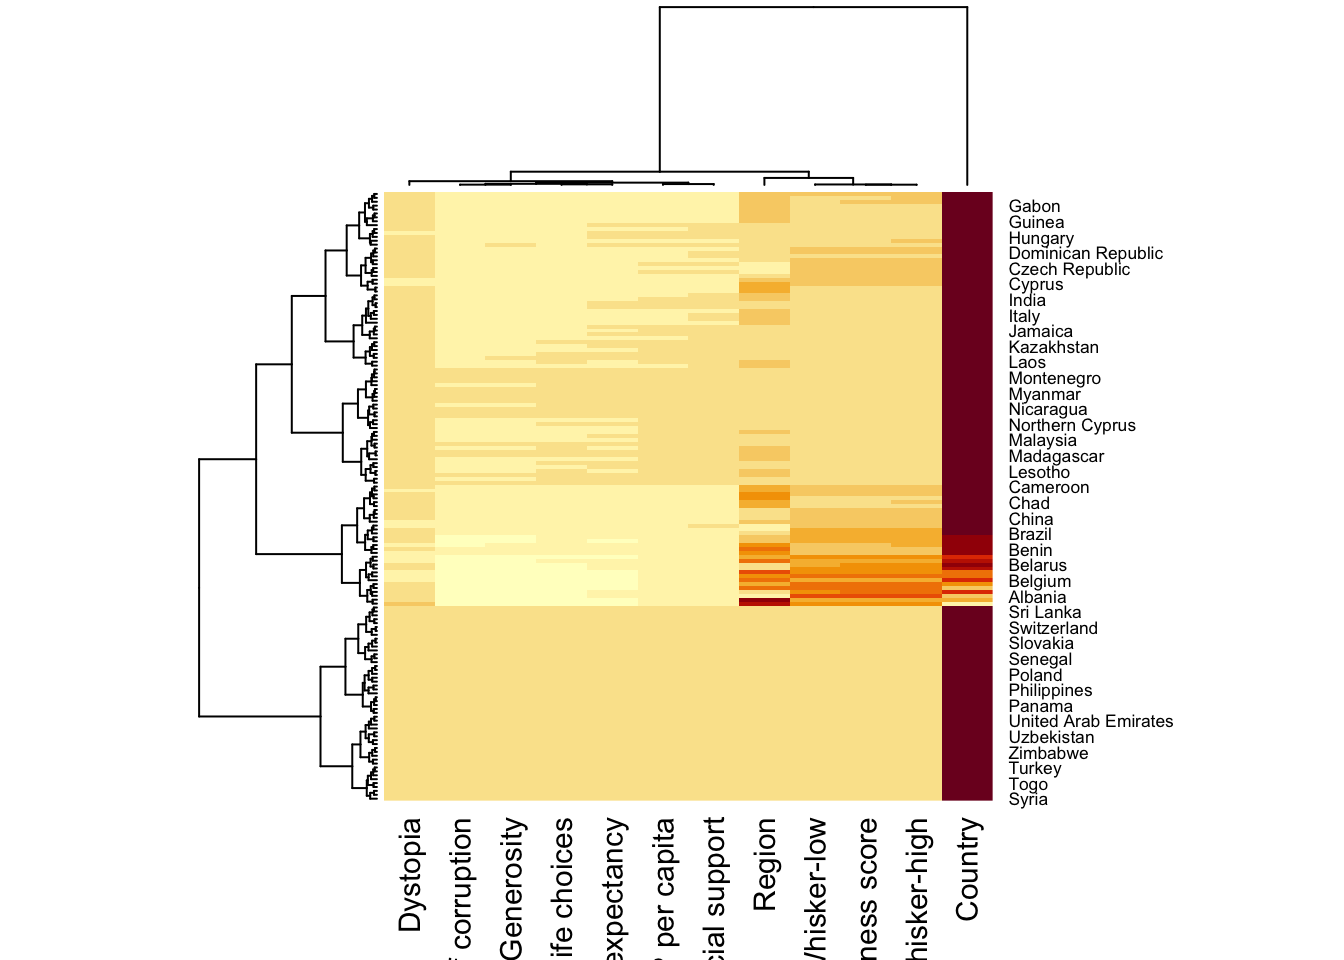
Normalise matric column-wise
wh_heatmap <- heatmap(wh_matrix,
                      scale="column",
                      cexRow = 0.6,
                      cexCol = 0.8,
                      margins = c(10, 4))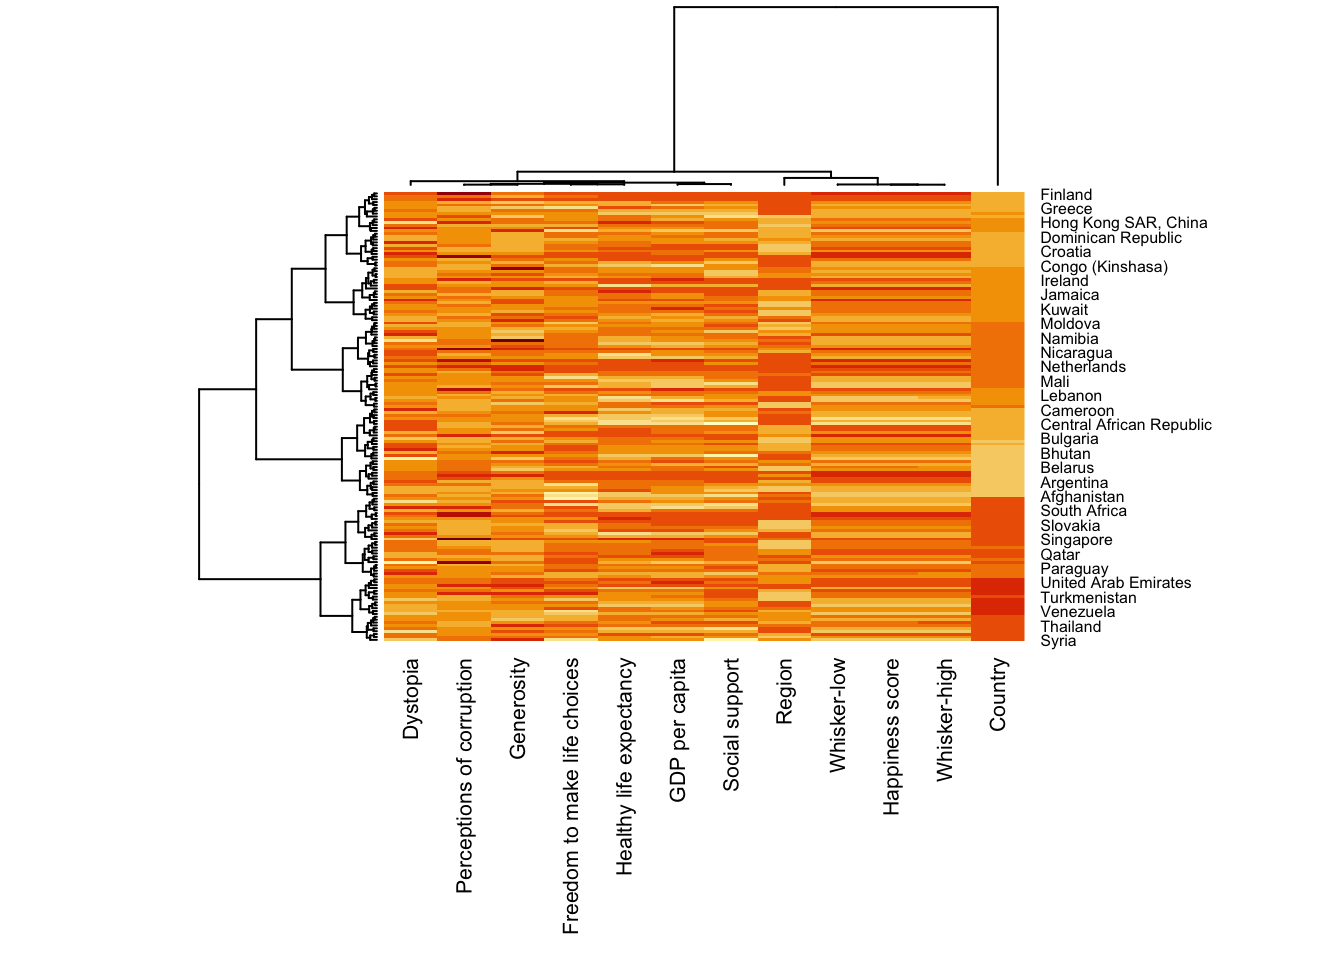
Create Interactive heatmap
There are a few ways to transform the data.
There are scaling method, normalising method and percentage method
heatmaply(wh_matrix[,-c(1,2,4,5)],
          scale = "column")
Warning in doTryCatch(return(expr), name, parentenv, handler): unable to load shared object '/Library/Frameworks/R.framework/Resources/modules//R_X11.so':
dlopen(/Library/Frameworks/R.framework/Resources/modules//R_X11.so, 0x0006): Library not loaded: '/opt/X11/lib/libSM.6.dylib'
Referenced from: '/Library/Frameworks/R.framework/Versions/4.2/Resources/modules/R_X11.so'
Reason: tried: '/opt/X11/lib/libSM.6.dylib' (no such file), '/Library/Frameworks/R.framework/Resources/lib/libSM.6.dylib' (no such file), '/Library/Java/JavaVirtualMachines/jdk1.8.0_241.jdk/Contents/Home/jre/lib/server/libSM.6.dylib' (no such file)heatmaply(normalize(wh_matrix[,-c(1,2,4,5)]))heatmaply(percentize(wh_matrix[, -c(1, 2, 4, 5)]))Further spread out
heatmaply(normalize(wh_matrix[, -c(1, 2, 4, 5)]),
Colv=NA,
seriate = "none",
colors = Blues,
k_row = 5,
margins = c(NA,200,60,NA),
fontsize_row = 4,
fontsize_col = 5,
main="World Happiness Score and Variables by Country, 2018 \nDataTransformation using Normalise Method",
xlab = "World Happiness Indicators",
ylab = "World Countries"
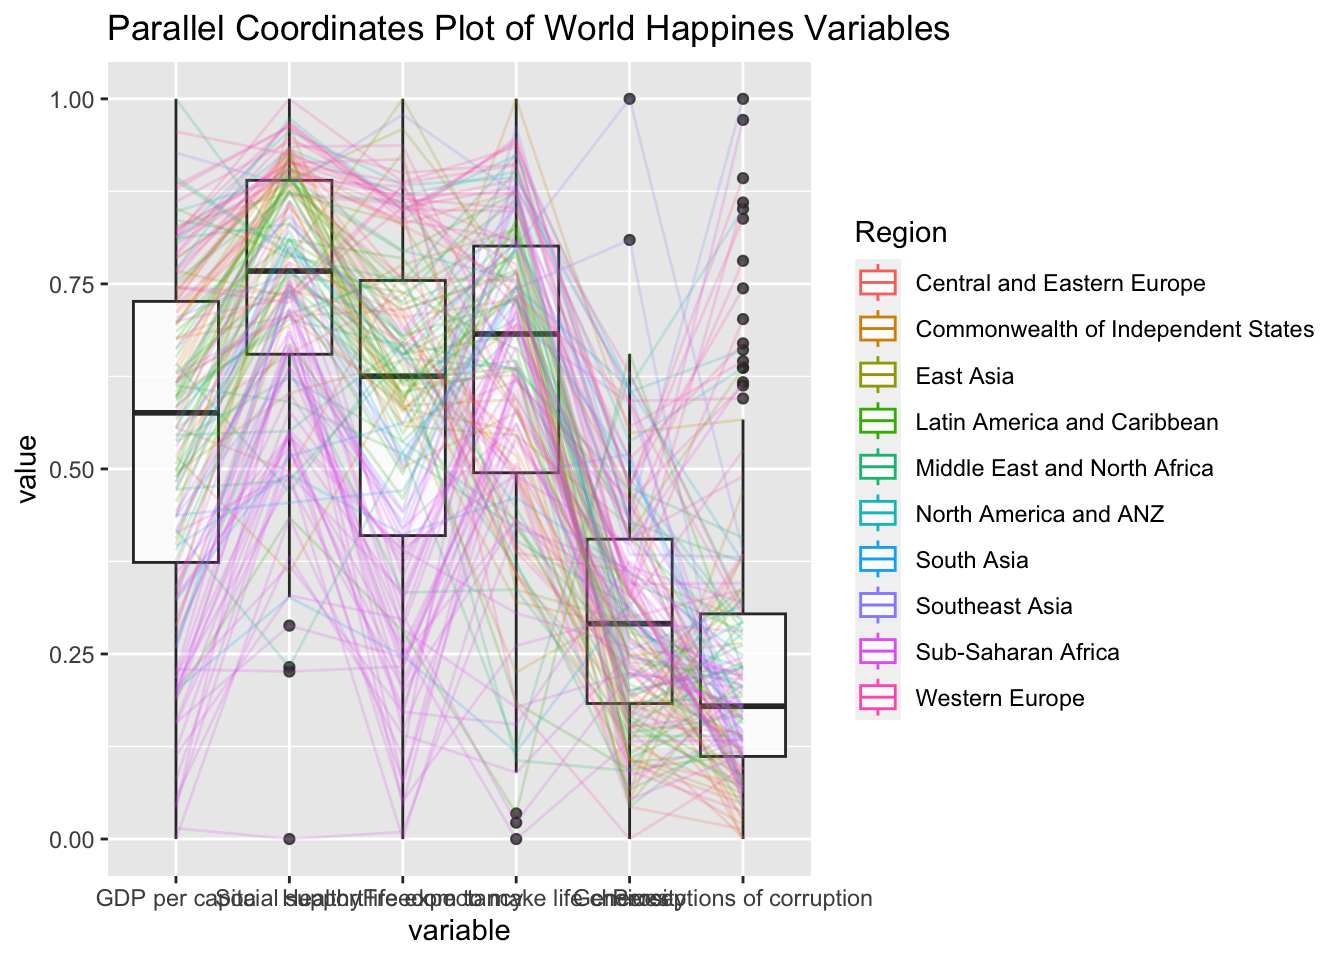
)Plot Static Parallel Coordinate
ggparcoord(data = wh,
           columns = c(7:12))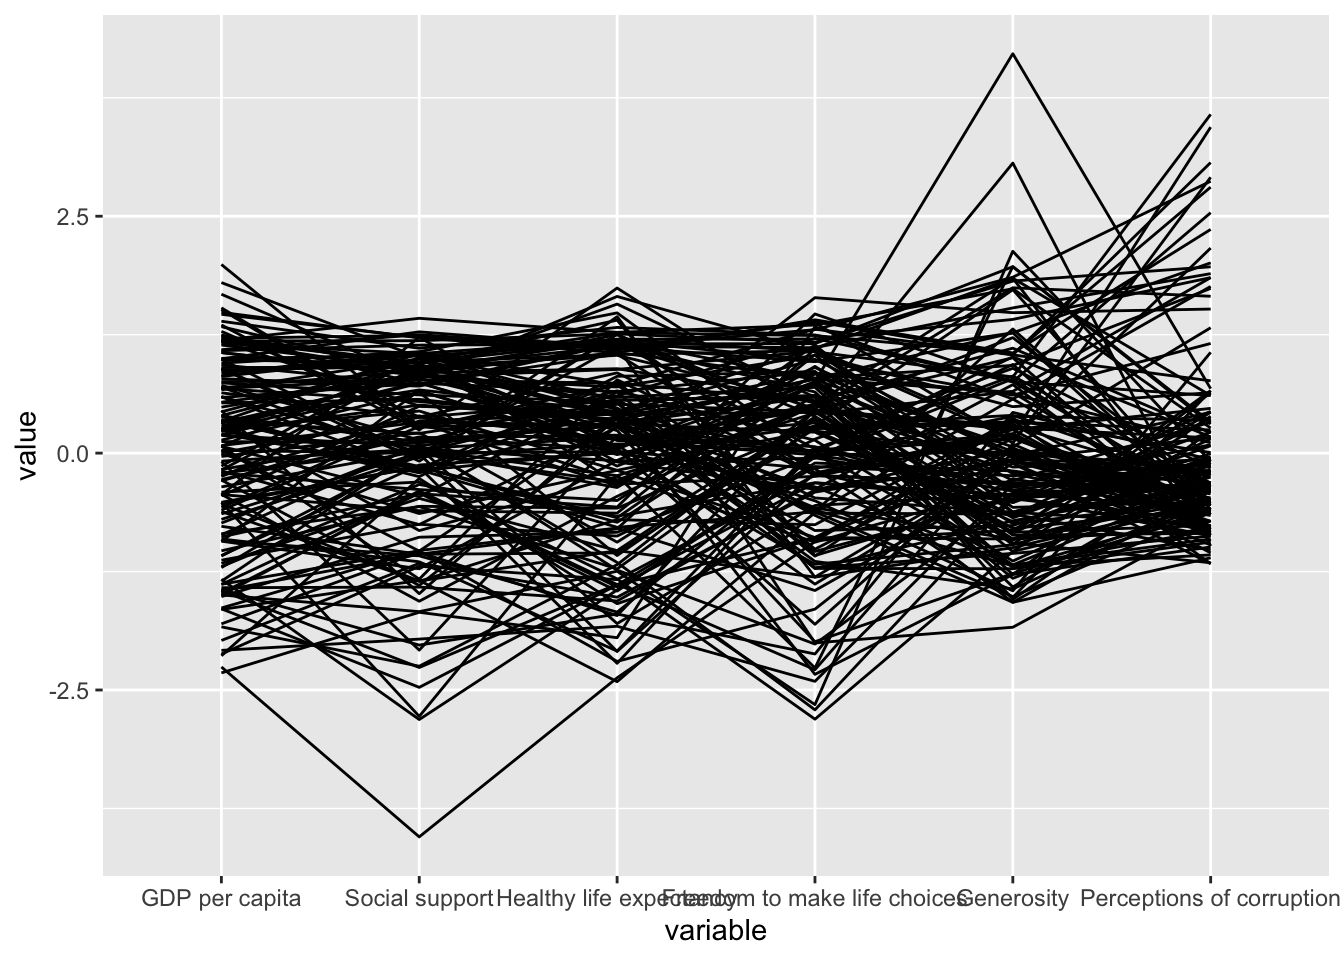
Plot Parallel coordinates with boxplot
ggparcoord(data = wh,
           columns = c(7:12),
           groupColumn = 2,
           scale = "uniminmax",
           alphaLines = 0.2,
           boxplot = TRUE,
           title = "Parallel Coordinates Plot of World Happines Variables")
Warning: The following aesthetics were dropped during statistical transformation: colour
ℹ This can happen when ggplot fails to infer the correct grouping structure in
the data.
ℹ Did you forget to specify a `group` aesthetic or to convert a numerical
variable into a factor?